Tesla FSD and Safety: By the Numbers
On February 18, 2026, Tesla said its drivers had crossed 8 billion cumulative miles on Full Self-Driving (Supervised). The company has framed this as progress toward a threshold Elon Musk has repeatedly described as necessary for safe unsupervised autonomy: roughly 10 billion miles of real-world experience. That framing sounds simple. More miles equals better software. But the real safety picture is not one number. It is a stack of different numbers measured in different operating conditions, with different definitions of what counts as an incident, and different levels of human backup still in the loop.
Explore Lexicon Labs Books
Discover current releases, posters, and learning resources at http://lexiconlabs.store.
Conversion Picks
If this AI topic is useful, continue here:
That is exactly why this topic matters now. Tesla is scaling FSD usage, has launched a paid robotaxi service in Austin, and is preparing Cybercab production. At the same time, critics are tracking reported crashes in robotaxi operations, and competitors like Waymo are publishing their own large-scale driverless safety results. So the right question is not whether 8 billion miles is impressive. It is. The right question is what those miles do and do not prove about safety today.
This breakdown focuses on what we can verify as of February 2026, including Tesla and Waymo disclosures, federal reporting context, and third-party analyses built from public filings. The goal is not hype or dunking. The goal is decision-grade clarity.
The Headline Number: 8 Billion FSD Miles
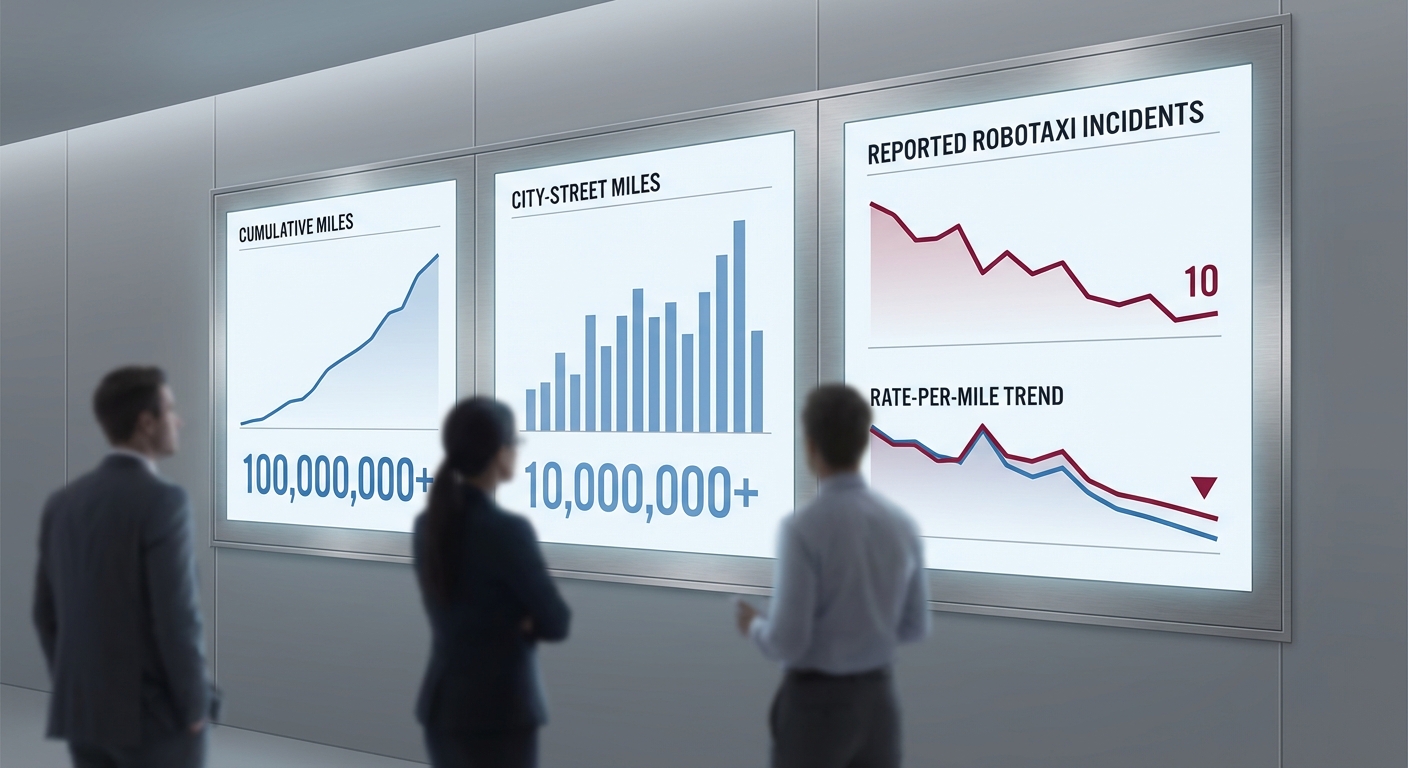
Tesla-linked reporting and market coverage on February 18, 2026 state that the fleet surpassed 8 billion cumulative miles on FSD (Supervised), with more than 3 billion of those miles on city streets. That city-street split matters because urban driving includes more edge cases: unprotected left turns, pedestrians stepping into lanes, bikes and scooters, odd curb geometry, parked delivery vehicles, temporary construction patterns, and more non-compliant agent behavior. In other words, city miles are generally information-dense miles.
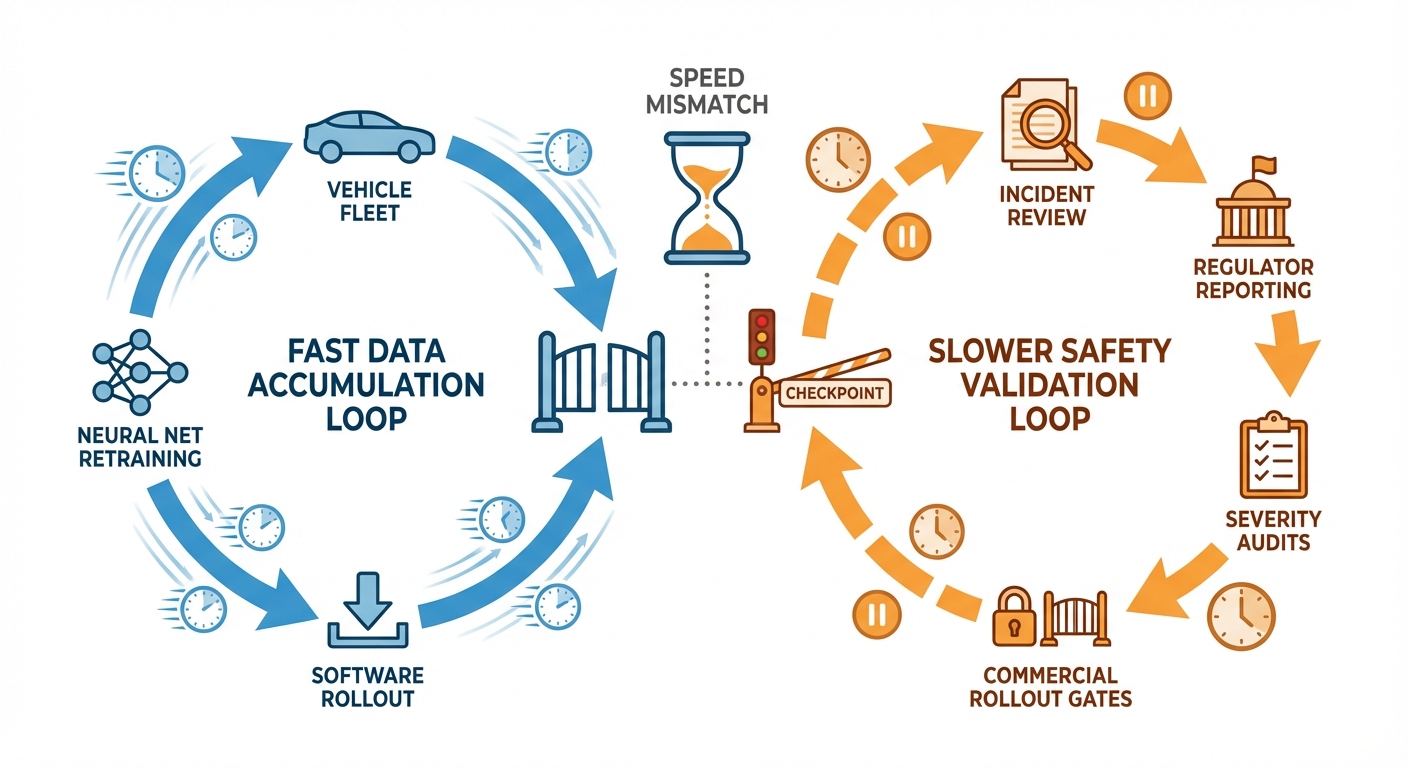
Still, cumulative fleet miles are not a direct safety score. They are a learning-input metric. They tell us the system has been exposed to large volumes of real-world variation. They do not automatically tell us intervention frequency, injury risk, or severity distribution in commercial driverless operations. A system can improve rapidly with data and still underperform in a specific operational domain, especially when that domain shifts from supervised consumer use to commercial autonomy.
That distinction becomes critical in 2026 because Tesla is operating across at least three practical layers: consumer FSD (supervised), supervised robotaxi operations, and initial no-safety-monitor rides in limited cases. The safety expectation for each layer is different.
What Tesla Is Trying to Prove with 10 Billion Miles
Musk has argued that unsupervised autonomy requires enough data to cover what he calls reality’s long tail. Conceptually, that argument is reasonable. Rare events dominate failure risk in autonomous systems. If a model has not seen enough combinations of weather, road markings, unpredictable human behavior, emergency vehicles, occlusions, and odd local traffic norms, it will fail in places that look routine to human drivers. More high-quality data can shrink those blind spots.
But there are two limits to this argument. First, not all miles are equally valuable. Ten million low-complexity highway miles at low interaction density do not buy the same long-tail coverage as ten million dense urban miles with diverse road users. Second, quality of labels and feedback loops matter as much as raw distance. If intervention and near-miss events are not captured, categorized, and fed back effectively, mileage growth can overstate learning progress.
So 10 billion is better interpreted as a scale signal than a guarantee threshold. It may indicate Tesla can train on increasingly broad scenarios. It does not, on its own, close the case on safe unsupervised deployment.
Robotaxi Safety Scrutiny in Austin
Now to the number driving most of the safety debate. Reporting based on NHTSA-filed crash disclosures says Tesla added five robotaxi incidents in December 2025 and January 2026, bringing the disclosed total to 14 incidents since the Austin service launch in June 2025. The same reporting estimates around 800,000 paid robotaxi miles by mid-January, implying approximately one crash per 57,000 miles in that commercial operation window.
A widely cited comparison in that reporting uses Tesla’s own benchmark that human drivers average a minor collision roughly every 229,000 miles. On that framing, robotaxi crashes appear roughly 4x more frequent than Tesla’s human baseline. Even if one debates exact comparability, this is enough to justify close monitoring. It is not a noise-level deviation.
The details of the newly disclosed events also matter: reported incidents include contact with a stationary bus, a heavy truck, fixed objects, and low-speed backing collisions. None of these are the cinematic high-speed edge cases people imagine when discussing autonomy. They are exactly the “boring but hard” operational interactions that should improve first in mature urban deployments.
Another important detail from coverage of the filings is that an earlier report was revised to add a hospitalization injury. Revisions in reported severity are not unusual in incident reporting systems, but they are important for interpreting trend quality. If severity classifications shift after initial filing, stakeholders need to track updates, not just first-published counts.
Why the Robotaxi vs Consumer FSD Comparison Is Tricky
A common mistake is to compare total consumer FSD miles directly with robotaxi incident rates and draw sweeping conclusions. These are different use cases and exposure profiles. Consumer supervised driving includes massive diversity in driver attention, route selection, takeover behavior, and local usage patterns. Robotaxi operations are more controlled but also concentrate on dense service geographies and repeated urban pickup-dropoff workflows where low-speed interactions are constant.
In addition, supervised consumer miles include a human who is explicitly expected to monitor continuously. Robotaxi safety should be judged against commercial autonomy standards, not consumer-assist framing. As soon as no-monitor rides enter service, scrutiny should tighten further. The burden of proof changes from “assistive system that can make mistakes while a human is responsible” to “service that must maintain safety margins in real time without immediate human fallback.”
What NHTSA Reporting Does and Does Not Tell You
NHTSA’s Standing General Order crash framework is essential, but it is not a complete scoreboard for relative AV safety. It is best used as a transparency channel and early warning system. The agency itself emphasizes that crash reports under this framework are not normalized exposure-adjusted rankings of one company versus another. Reporting triggers, fleet sizes, operating design domains, and miles driven differ substantially.
That means you can responsibly use SGO-linked data to track trend direction, incident typology, and severity developments, but not to make simplistic “winner/loser” claims without denominator context. If a service triples its miles while incidents rise modestly, risk per mile may improve even if raw incident counts rise. Conversely, if mileage is small and incident counts jump, concern can be justified quickly.
In Tesla’s case, the current debate is exactly this denominator problem. The fleet-level FSD denominator is enormous. The commercial robotaxi denominator is still relatively small. Policy and public trust outcomes will likely be driven more by the second denominator than the first.
Tesla vs Waymo: Why This Comparison Is Everywhere
Waymo says it has crossed 127 million rider-only miles and over 10 million rider-only trips as of February 2026, with no human in the driver seat. That is a very different operating claim from supervised systems. It is also why investors, regulators, and the public increasingly frame this race as one between two autonomy philosophies: broad supervised scale first (Tesla) versus constrained but driverless ODD expansion (Waymo).
The most useful way to compare them is not ideological. It is operational:
- Tesla strength: unmatched supervised mileage scale, rapid software iteration, and vertically integrated hardware-production stack.
- Tesla challenge: converting supervised fleet learning into consistently lower incident rates in commercial no-monitor operations.
- Waymo strength: large, disclosed rider-only base with long-running driverless operations in geofenced domains.
- Waymo challenge: scaling footprint, economics, and vehicle throughput while keeping safety deltas favorable.
In short, Tesla is proving breadth. Waymo is proving depth in selected zones. Markets, regulators, and cities will decide over time which proof carries more weight for different deployment types.
How to Read Tesla’s Safety Story Without Getting Misled
There are four numbers you should watch together each quarter rather than in isolation.
- Cumulative supervised FSD miles: measures training and exposure scale.
- Commercial robotaxi miles: measures size of real driverless business exposure.
- Incident rate per mile in robotaxi operations: the most decision-relevant operational safety metric for service rollout.
- Severity distribution: property damage-only, injury, hospitalization, and event context.
If cumulative miles rise quickly but robotaxi incident rate does not decline meaningfully, the autonomy thesis weakens in the near term. If robotaxi rates improve steadily while no-monitor miles expand, the thesis strengthens materially, even if raw incident counts still rise during scale-up.
The Near-Term Milestones That Matter Most in 2026
Tesla’s next milestones are unusually clear. First, progress from 8 billion toward 10 billion supervised miles. Second, operational data from expanding no-monitor rides. Third, Cybercab production readiness and service integration. A manufacturing launch can increase deployment potential fast, but it also amplifies safety-accountability pressure because exposure can scale before public confidence catches up.
This is where communication quality matters. If Tesla wants to win the public trust race, it needs more than milestone headlines. It needs durable, repeatable, denominator-aware reporting that makes it easy for independent observers to evaluate trend direction without reverse engineering from fragmented filings.
Bottom Line: Is Tesla Safer Yet?
The data supports two statements at once.
First, Tesla has achieved a remarkable supervised learning scale milestone. Eight billion FSD miles, including billions in city environments, is a real technical asset and likely a meaningful advantage in rare-scenario discovery. Second, early robotaxi incident-rate analysis in Austin, based on publicly reported filings and paid-mile estimates, raises legitimate safety questions that cannot be dismissed by cumulative fleet miles alone.
So the honest answer is this: Tesla may be building the ingredients for safe unsupervised autonomy, but the current commercial robotaxi evidence remains mixed. The next six to twelve months will matter more than any single cumulative mileage milestone because this is the period where supervised learning claims must translate into better real-world commercial safety ratios.
Key Takeaways
- Tesla’s reported 8 billion FSD miles is a major scale milestone, but it is a training-input metric, not a standalone safety verdict.
- Coverage of NHTSA-filed robotaxi incidents indicates 14 disclosed crashes since June 2025 in Austin, with an estimated one crash per 57,000 miles by mid-January 2026.
- Comparisons to human-driver benchmarks depend heavily on matching conditions, denominator quality, and severity definitions.
- NHTSA SGO data is critical for transparency but should be treated as directional safety surveillance, not a normalized league table.
- Waymo’s reported 127 million rider-only miles without a driver sets a high benchmark for commercial driverless validation.
- The most important 2026 question is whether Tesla’s robotaxi incident rate improves as no-monitor miles and service scale increase.
Sources
- Tesla Vehicle Safety Report
- Teslarati: Tesla FSD surpasses 8 billion miles
- Electrek: Tesla reports additional robotaxi crashes
- TipRanks: Tesla drivers surpass 8 billion miles on FSD software
- NHTSA Standing General Order Crash Reporting
- Waymo Safety Impact
Keywords
Tesla, FSD, robotaxi, autonomy, safety, crash, miles, Waymo, NHTSA, Cybercab, Austin, AI
Related Reading
- Google Gemini 3.1 Pro: The Competition Intensifies Against Anthropic and OpenAI
- OpenClaw and the Dawn of Agentic Engineering
- Seedance 2.0: Hollywood on Your Desktop
Stay Connected
Follow us on @leolexicon on X
Join our TikTok community: @lexiconlabs
Watch on YouTube: @LexiconLabs
Learn More About Lexicon Labs and sign up for the Lexicon Labs Newsletter to receive updates on book releases, promotions, and giveaways.
.jpg)


